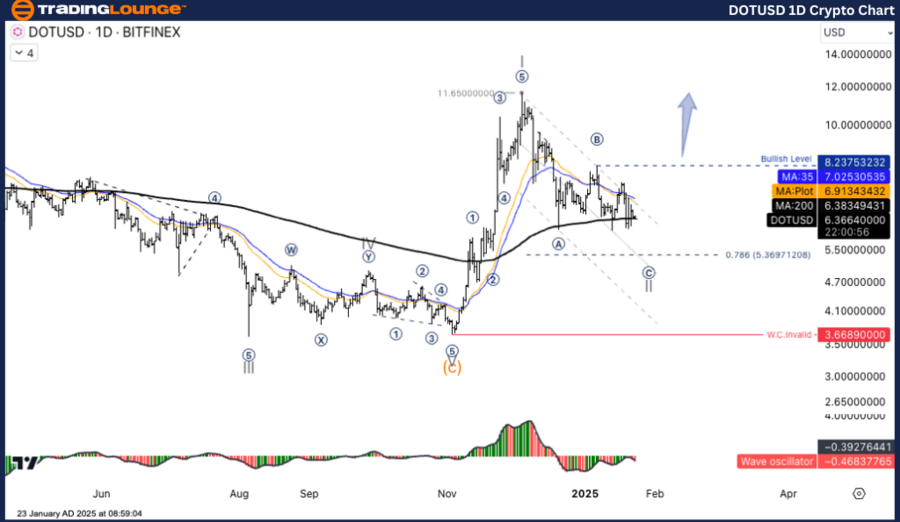
- Polkadot price is likely in a corrective phase, with potential for further decline.
- The 5.3691 support level is crucial; a break below could signal the end of the correction.
Polkadot (DOT) has been experiencing a notable correction, with the price currently believed to be within a Wave II structure. This corrective phase typically exhibits an A-B-C pattern, and the market appears to be navigating through this sequence.
Wave A saw a sharp decline from recent highs, indicating a significant shift in market sentiment. This was followed by a rebound in Wave B, suggesting a temporary pause in the downward momentum. However, analysts anticipate that the corrective phase will continue, with the price potentially reaching lower target zones.

A critical level to monitor is the 5.3691 support zone. A decisive break below this level could signal that Wave II is nearing its conclusion. This would likely pave the way for a resumption of the broader uptrend, albeit with increased volatility.
What this means for traders:
- Cautious Approach: Traders should exercise caution in the near term, as the market may continue to experience downward pressure.
- Support Level: The 5.3691 support zone is a crucial level to watch. A break below this level could indicate a significant shift in market dynamics.
- Potential for Reversal: While the near-term outlook appears bearish, a break below the support level could potentially mark the end of the corrective phase and pave the way for a renewed uptrend.


